Area Models Simplify Probability

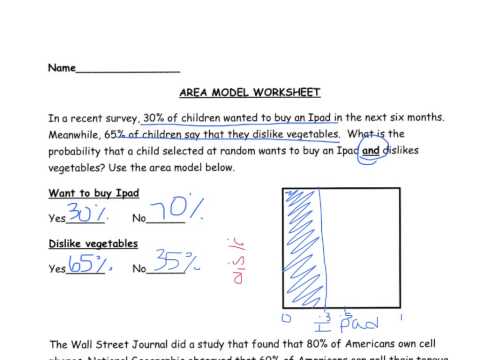
Understanding probability can be a daunting task, especially when dealing with complex events or large datasets. However, by leveraging area models, individuals can simplify probability calculations and gain a deeper understanding of the underlying principles. In this article, we will delve into the world of area models and explore how they can be used to demystify probability.
To begin with, let’s consider a basic concept in probability: the idea of independent events. When two events are independent, the occurrence of one does not affect the probability of the other. For instance, flipping a coin twice can result in one of four possible outcomes: heads-heads, heads-tails, tails-heads, or tails-tails. Each outcome has a probability of 1⁄4 or 25%. By using an area model, we can visualize these outcomes and their corresponding probabilities.
<div class="expert-insight">
    <p>Area models are particularly useful for illustrating the concept of independent events. By dividing a rectangle into smaller sections, each representing a possible outcome, we can easily calculate probabilities and visualize the relationships between events.</p>
</div>
One of the primary benefits of area models is their ability to simplify complex probability calculations. By breaking down events into smaller, more manageable components, individuals can avoid errors and ensure accurate results. For example, consider a scenario where we want to calculate the probability of drawing a specific card from a standard deck of 52 cards. Using an area model, we can divide the deck into suits (hearts, diamonds, clubs, and spades) and then further divide each suit into individual cards.
<table>
    <tr>
        <th>Suit</th>
        <th>Number of Cards</th>
        <th>Probability</th>
    </tr>
    <tr>
        <td>Hearts</td>
        <td>13</td>
        <td>13/52 = 1/4</td>
    </tr>
    <tr>
        <td>Diamonds</td>
        <td>13</td>
        <td>13/52 = 1/4</td>
    </tr>
    <tr>
        <td>Clubs</td>
        <td>13</td>
        <td>13/52 = 1/4</td>
    </tr>
    <tr>
        <td>Spades</td>
        <td>13</td>
        <td>13/52 = 1/4</td>
    </tr>
</table>
As we can see, the area model provides a clear and concise way to visualize the relationships between different suits and calculate the probability of drawing a specific card.
Another advantage of area models is their ability to facilitate the calculation of conditional probabilities. Conditional probability refers to the probability of an event occurring given that another event has already occurred. For instance, consider a scenario where we want to calculate the probability of drawing a heart given that the first card drawn was a heart. Using an area model, we can update the probabilities to reflect the new information and calculate the conditional probability.
<div class="step-by-step">
    <p>Step 1: Calculate the initial probability of drawing a heart (13/52 = 1/4)</p>
    <p>Step 2: Update the probability of drawing a heart given that the first card drawn was a heart (12/51 = 4/17)</p>
    <p>Step 3: Calculate the conditional probability of drawing a heart given that the first card drawn was a heart (4/17)</p>
</div>
In addition to simplifying probability calculations, area models can also be used to explore more advanced concepts, such as Bayesian inference. Bayesian inference is a statistical framework for updating the probability of a hypothesis based on new evidence. By using area models, individuals can visualize the relationships between different hypotheses and update their probabilities accordingly.
<div class="pro-con">
    <p>Pros of using area models for Bayesian inference:</p>
    <ul>
        <li>Simple and intuitive visualization of complex relationships</li>
        <li>Easy to update probabilities based on new evidence</li>
        <li>Facilitates exploration of different hypotheses and their relationships</li>
    </ul>
    <p>Cons of using area models for Bayesian inference:</p>
    <ul>
        <li>Can be limited by the complexity of the relationships being modeled</li>
        <li>Requires careful consideration of prior probabilities and updating rules</li>
        <li>May not be suitable for very large or complex datasets</li>
    </ul>
</div>
In conclusion, area models provide a powerful tool for simplifying probability calculations and exploring advanced concepts, such as conditional probability and Bayesian inference. By leveraging these models, individuals can gain a deeper understanding of probability and make more informed decisions in a wide range of fields.
<div class="faq-section">
    <div class="faq-container">
        <div class="faq-item">
            <div class="faq-question">
                <h3>What is the primary benefit of using area models in probability calculations?</h3>
                <span class="faq-toggle">+</span>
            </div>
            <div class="faq-answer">
                <p>The primary benefit of using area models is their ability to simplify complex probability calculations and provide a clear and concise way to visualize the relationships between different events.</p>
            </div>
        </div>
        <div class="faq-item">
            <div class="faq-question">
                <h3>How can area models be used to calculate conditional probabilities?</h3>
                <span class="faq-toggle">+</span>
            </div>
            <div class="faq-answer">
                <p>Area models can be used to calculate conditional probabilities by updating the probabilities to reflect the new information and calculating the conditional probability based on the updated probabilities.</p>
            </div>
        </div>
        <div class="faq-item">
            <div class="faq-question">
                <h3>What is the relationship between area models and Bayesian inference?</h3>
                <span class="faq-toggle">+</span>
            </div>
            <div class="faq-answer">
                <p>Area models can be used to explore Bayesian inference by visualizing the relationships between different hypotheses and updating their probabilities based on new evidence.</p>
            </div>
        </div>
    </div>
</div>

